"Who is right?"
When something breaks, it is one vendor's claim against another's. Without evidence, the argument takes days.

DE EN
Request a demoHome Products
Analyzer, Testbench, Monitoring, the way you need it, all in one Platform. Fleet-controller vendors, vehicle manufacturers and the operators who run mixed fleets work on the same traffic, with the same checks and the same evidence.
An independent tool. It reads VDA 5050, VDMA LIF and VDMA M2X and reports what deviates from them. It issues no certification and no release approval, and neither the VDA nor the VDMA is affiliated with it, endorses it or has reviewed the checks it applies. More in the imprint.
The vehicle and the fleet controller come from different vendors. The specification describes the messages. It does not prove that both sides read them the same way. When they do not, three questions cost real time.
When something breaks, it is one vendor's claim against another's. Without evidence, the argument takes days.
A green tick without a scope is worthless. An acceptance test has to state which rules ran, which did not apply and why.
The fault appears once, on a Friday evening. Without a recording that keeps its context, all that is left is to reproduce it, and hope.
VDA5050 is a promise between three parties. The fleet-controller vendor talks to vehicles it did not build; the vehicle manufacturer delivers into sites it does not run; the operator relies on both meaning the same protocol. The analyzer gives all three the same view of the same traffic, and each role the tools it needs.
Writes its requirements down once and hands them out as a file. Drives new vehicle types against virtual fleets before any test rig exists. And decides about its own badge: nothing counts as passed until the vendor releases it.
Measures on its own bench against the published requirements of every target fleet controller, as often as it takes, with nobody watching. What is missing comes back as named lines, not as a rejection.
Watches the site live, receives reports on a schedule and holds evidence during an incident instead of two competing claims. Acceptance ends in a signed package that still verifies months later.
Onboarding weeks are born where each side points its own tools at its own recordings. On one platform, the requirement, the measurement and the evidence are the same files.
A fleet controller vendor and a vehicle manufacturer meet at every onboarding. Most of the first weeks repeat what the last project already covered: the same requirements explained by phone, the same questions answered on site.
The controller vendor puts its requirements into a file: which checks have to pass, how much coverage a run needs, which actions a vehicle has to declare. The file goes out with the interface guide. Nobody has to repeat it on a call.
The manufacturer records a shift on its own bench and holds it against that file, as often as it likes. What is still missing comes back row by row, not as a rejection somebody has to interpret.
The vendor approves the link between both sides. Only then does a report carry its badge. Nobody issues themselves a passing mark.
What reaches the site is what a recording cannot answer. Questions that used to cost a trip are settled before the vehicle is loaded onto a truck.
The saving sits in the part that repeats. Engineers on both sides join where a decision needs them, not to work out which of two systems read the same message differently.
Schema, protocol header, order and state structure, node, edge and action lifecycles, order-state correlation, battery and safety.
Peripheral interfaces: load handling, doors, lifts, signal lights, charging devices and transport orders, against the official schemas.
Layout files: schema, node and edge integrity, reachability across the graph, station references. Layouts in the coming LIF 2.0.0 are read as a preview and marked as one.
M2X is not final yet. Its results are marked as a preview and make no claim to certification. VDA5050 and LIF are unaffected.
.log, .txt, .json or
.ndjson. The importer detects the message type, reports lines it
could not read and keeps the field order of the source.
Several files at once are read and listed first; you then decide whether they stay apart or merge into one log, ordered by the timestamp the messages carry, an overlap between two files kept once, and a repetition inside one file left alone, because that is a finding.
A capture profile connects to the broker, records in the background and analyses every message as it arrives, several profiles at once.
The same profile can mirror the traffic onto a second broker, running as a transparent proxy between vehicles and controller without disturbing live operation.
A connector is the same profile without an end: no daily limit, it comes back by itself after an interruption and starts with the service. For an installation that does not stop, and what the monitoring pages read.
Not one pass over the text but four layers, each building on the last. And a second number saying how much of all that a recording actually reached.
Every message against the official JSON schema of the target version: 1.1, 2.0.0, 2.1.0 and 3.0 separately, because each of them renamed fields the others still carry.
Layer 1Required fields, types, ISO-8601 timestamps, semantic version, arrays where arrays belong.
Layer 2headerId gaps and regressions, timestamp regressions, node and edge sequences, action lifecycles.
Layer 3Is an order acknowledged? Does the reported progress match the order that was issued? Both per vehicle.
Layer 4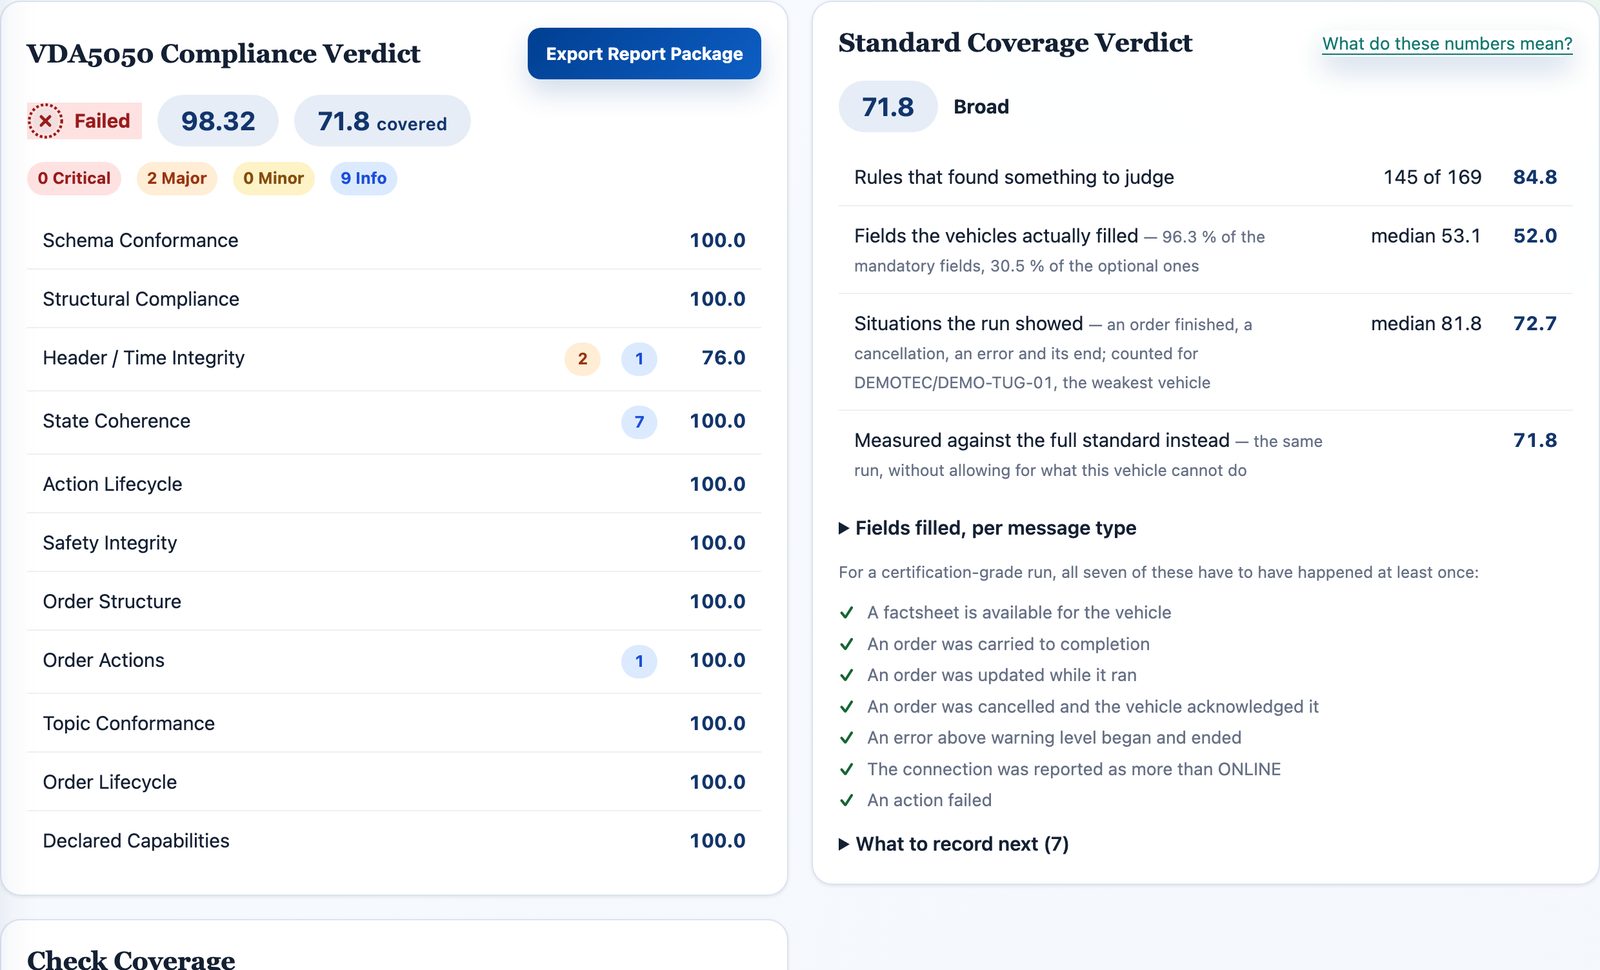
A score says how much of what was tested passed. It says nothing about how much there was to test, and a flawless score over a third of the rules proves very little. Every run therefore carries a second figure: coverage, how much of the standard the recording actually put to the test.
It is measured against what this vehicle is supposed to be able to do: everything the target version describes, minus what the vehicle's own factsheet says it has no hardware for. Three questions make it up: did the rules find anything to judge, did the vehicles fill the fields the standard defines, and did the run ever show the situations that only occur when something is done. With several vehicles the figure is the lowest of them, not the average.
Seven things have to have happened at least once before a run is certification-grade: an order carried to completion, one updated while it ran, one cancelled and acknowledged, an error that began and ended, and so on. The report names the ones still open, and what to record to close them. Neither number ever moves the other.
Every vehicle declares in its factsheet what it can do. 22 of the checks measure the traffic against that declaration and they answer a different question from the rest: not “does this message follow the standard” but “can this vehicle handle it”.
An action that is not in the vehicle's catalogue. An optional parameter it never claimed to support. An order beyond the declared length, array and timing limits.
More states reported than promised, state messages faster or slower than its declared interval, loads outside its own specification.
Every finding names the side that caused it. So the most common commissioning argument ends with an answer instead of two assertions. The factsheet itself is checked on import and can be viewed in the tool, properly formatted.
Without a factsheet this group reports “no data”, never “passed”. A report claiming conformance against a reference nobody supplied would be exactly the false confidence this tool exists to prevent. A fleet has more than one type of vehicle, so a run takes one factsheet per type, each matched to the vehicle it names, and the report says, vehicle by vehicle, which ones were measured against a declaration and which were not. A vehicle passed over must not look like one that passed.
No fleet fails commissioning on VDA5050 alone. Every integration guide has a sentence like this one: “pickFromBin requires a binId of the form BIN-0000”. A custom ruleset carries it into the same machinery that evaluates the standard.
The file is declarative JSON against a published schema, interpreted by seven fixed rule types: a field value, an embedded JSON Schema, a count, message spacing, monotonicity, a forbidden value, an allowed-transition table. Nothing in it is ever executed.
A custom rule never moves the VDA5050 verdict. The report shows both: the standard alone, and the standard plus your rules, and the first is settled before the first custom finding exists.
A copy of the rulesets used is written next to the report files, and the audit block carries the name, version and SHA-256 of each. Replacing the upload later never changes what an existing report was measured with.
Selected on the Analyze page and on capture profiles like any built-in check, marked CR on every finding. Included from the Project plan (three rulesets), without limit from Team upwards; up to 200 checks and 2 MB per file. Uploading is reserved for superusers, because a ruleset changes what every member's runs are judged with.
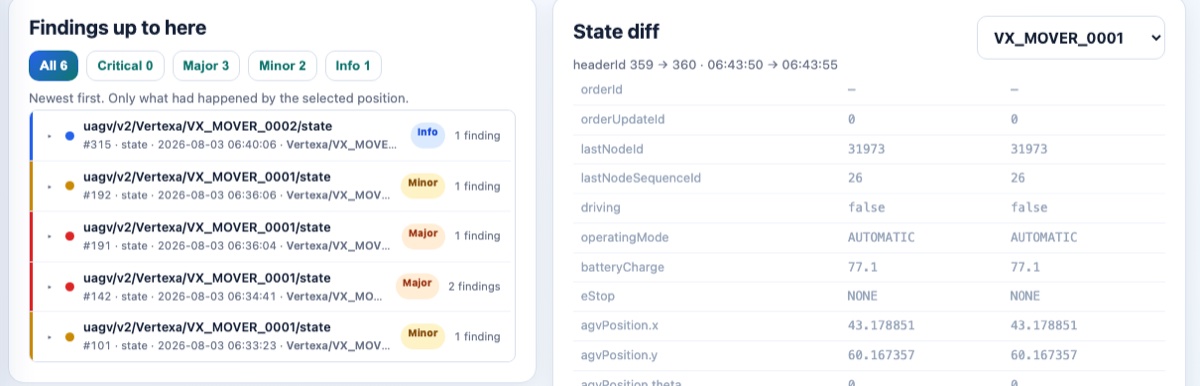
Each finding shows the message that triggered it, with the offending field path highlighted, not just a line number. Beside it, the previous, current and next message scroll as one, so you read a deviation in context.
Filter by severity and by vehicle, grouped by check or by message, depending on whether you are after a pattern or a single incident.
And because acceptance ends with a list, the report records it: each finding carries a disposition, accepted deviation, false positive or to fix, with a mandatory justification and its author. Standing waivers cover deviations that recur in every recording, re-runs inherit past decisions, and two runs can be compared check by check. None of it moves a verdict, and all of it travels in the signed package.
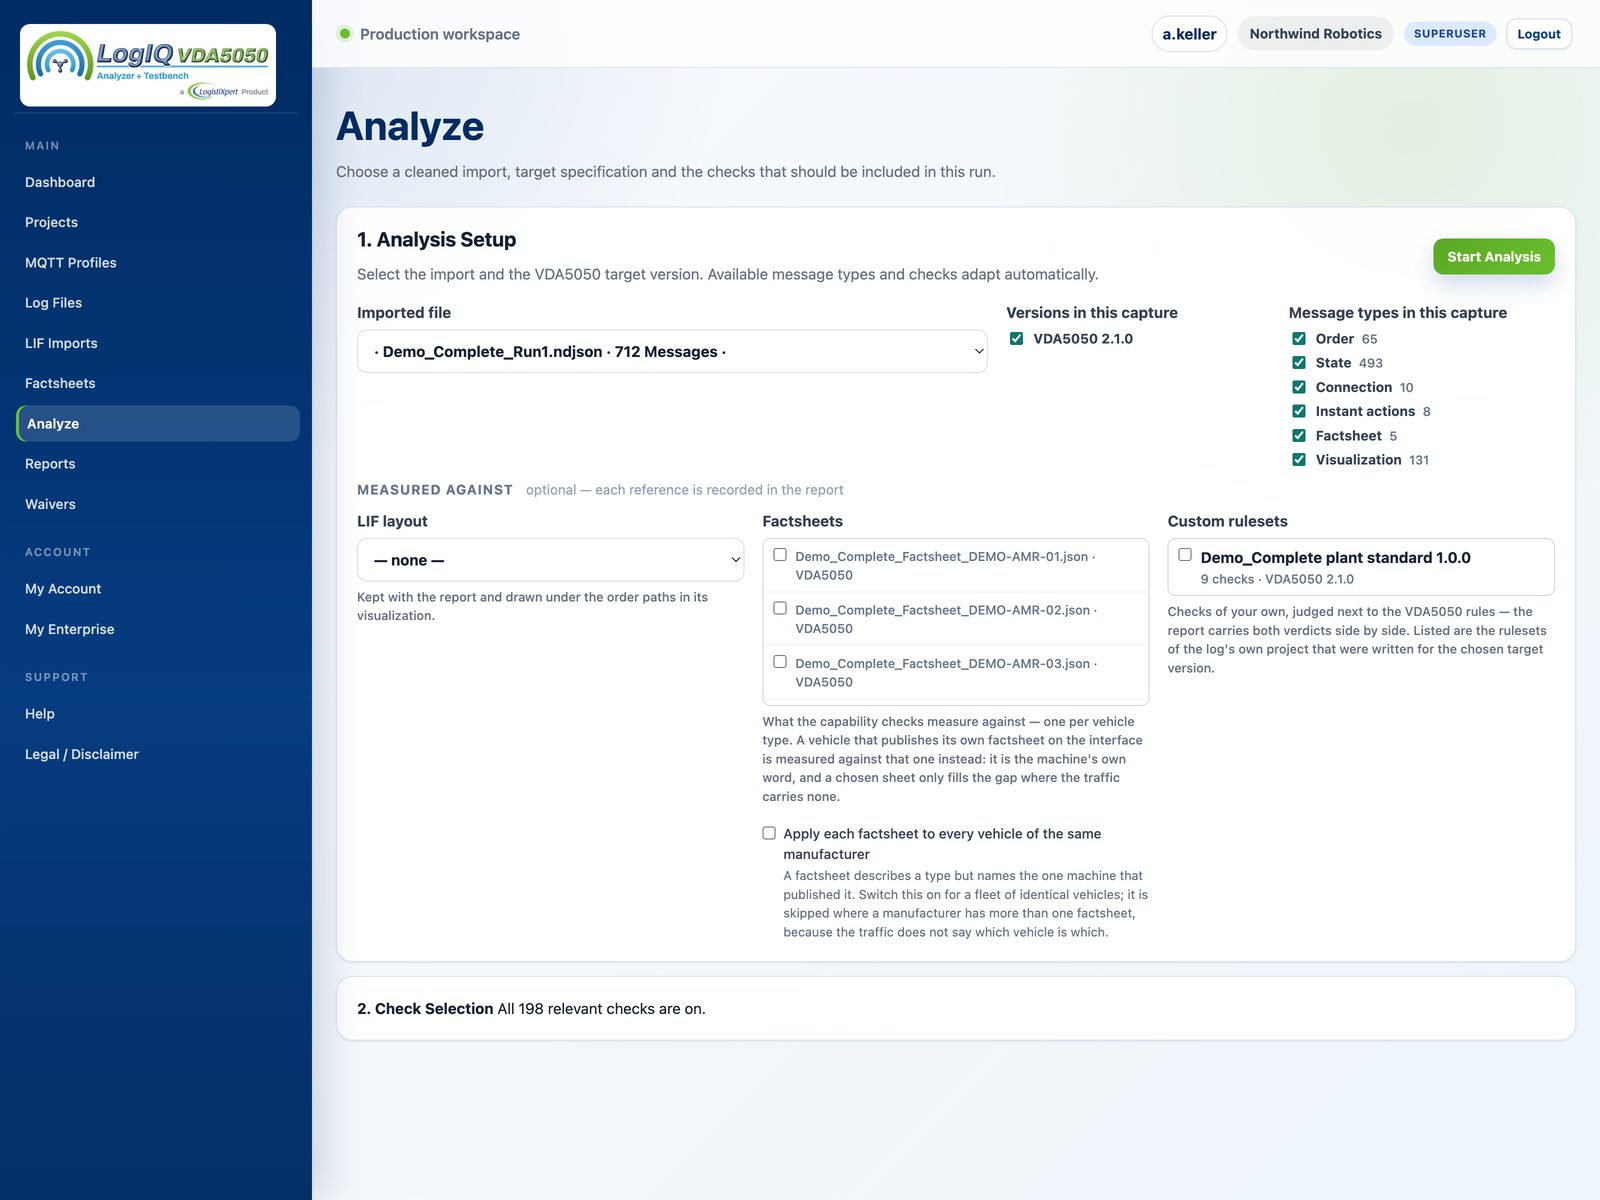
The page reads the file first and then offers what is actually in it: every VDA5050 version the traffic carries, and every message type with its count. Untick a version and it leaves the run; untick a type and those messages never reach the checks at all.
Each version gets its own tab and its own selection, showing only the rules that version knows: a corridor rule is not a choice under 1.1, and a rule the judged version never had is not counted as passed either. Every check names the clause it comes from, in the document you are being measured against.
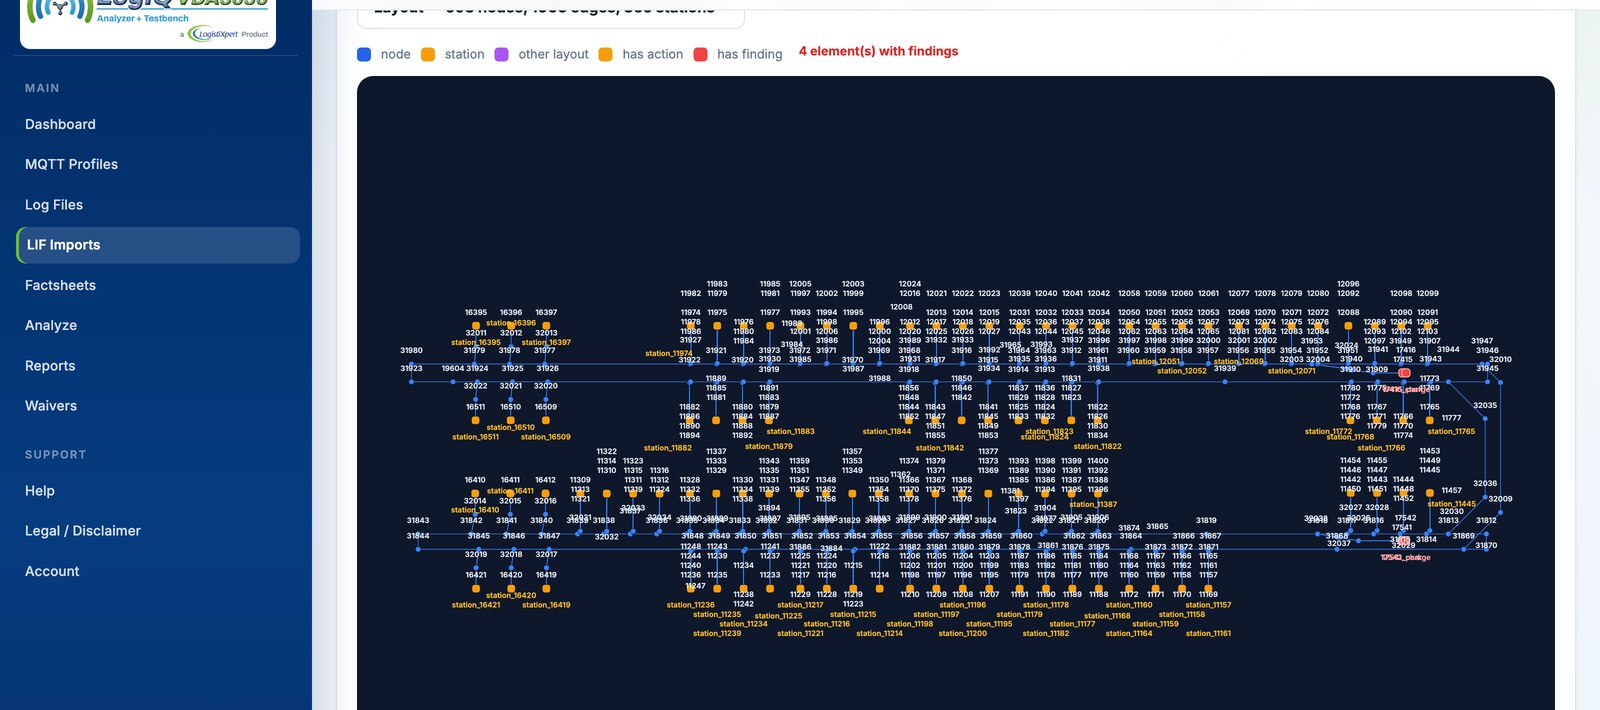
A LIF file is checked as a document for schema, duplicate ids, dangling edges and isolated nodes, and drawn as what it describes: every node at its real position, stations and actions marked, elements with findings in red.
Zoom and pan; names appear as you zoom in. Where two would sit on top of each other one steps aside rather than vanishing, because a name that is not drawn is a node you cannot find.
A report exports as one signed package: the report, the file that was analysed, the cleaned messages and every reference, with a manifest carrying the SHA-256 of each file and an Ed25519 signature over it. Whoever receives it checks it against our public key and knows it came from us and is unaltered.
Every rule is Active, No data or Switched off, never a silent pass. Each run records what it was made from: the project, the log file, the LIF layout and factsheets, the messages by type and every vehicle by name, with the target version, the schema revisions, an input checksum and the time.
The order path is drawn on the imported LIF layout and compared node by node and edge by edge, the most common reason a vehicle rejects an order. On a mismatch, every missing node is named.
headerIds are counted per topic; the topic carries manufacturer and serial. Every sequence, lifecycle and correlation is evaluated per vehicle, so ten vehicles are not one vehicle's findings times ten.
Everything above reads traffic that already happened. The testbench is the other direction: it plays the fleet controller itself, sends real VDA5050 orders and watches a vehicle answer. Against a real vehicle on a real broker, or against the built-in virtual one with nothing connected at all.
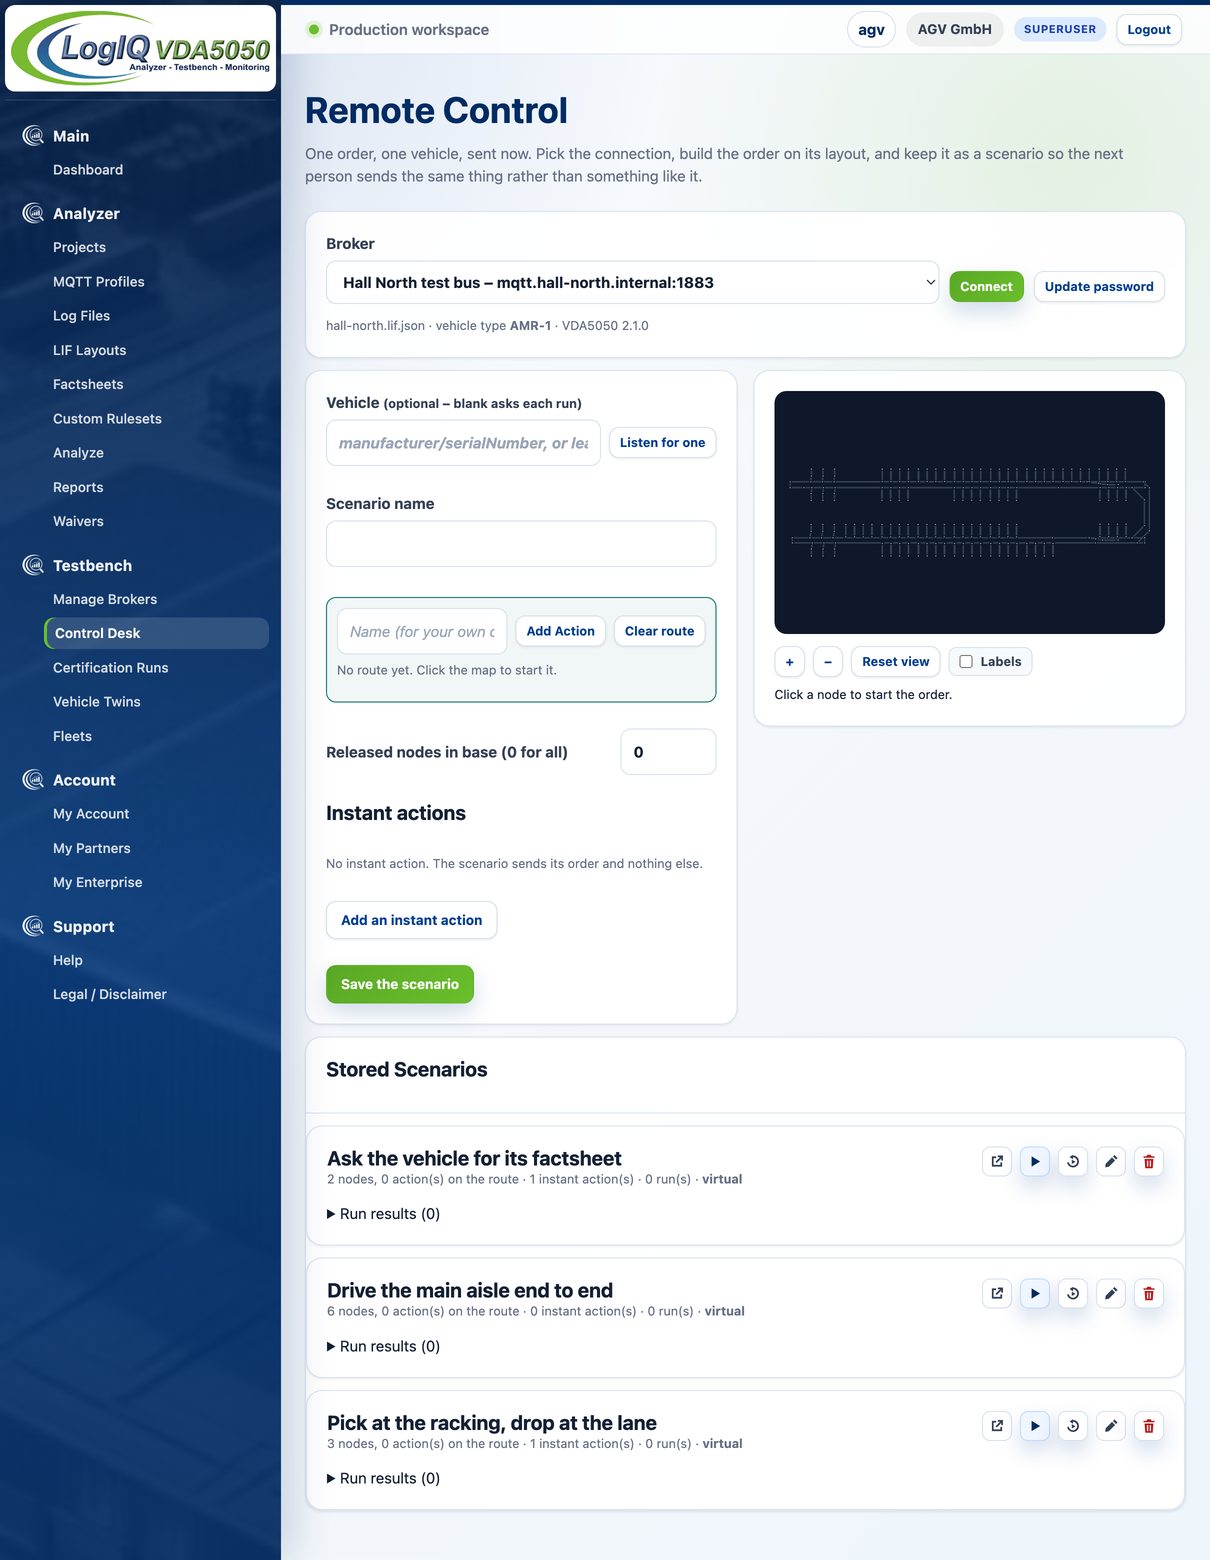
Pick a connection, build an order or an instant action on its layout, send it, watch what comes back. This is the page for the question does this vehicle do this at all, before anybody plans a run that assumes it does.
Instant actions are offered from the vehicle's own factsheet where one is known, so what you can send is what the vehicle said it supports rather than what the standard allows in general. Keep an order as a scenario and the next person sends the same thing rather than something like it.
A connection is stored once: address, port, credentials, the layout the orders are built on, the vehicle type and the version. The layout is not optional here — without one there are no nodes to send a vehicle to, so a broker without a layout cannot carry a run.
An ordered list of segments, each carrying the scenarios it exists to prove, built from your own layout and your own vehicle. What separates it from a sequence of orders is that it has to provoke: hold a horizon back and release it, cancel a running order, ask for a factsheet. A vehicle that never meets an awkward moment has not shown you anything.
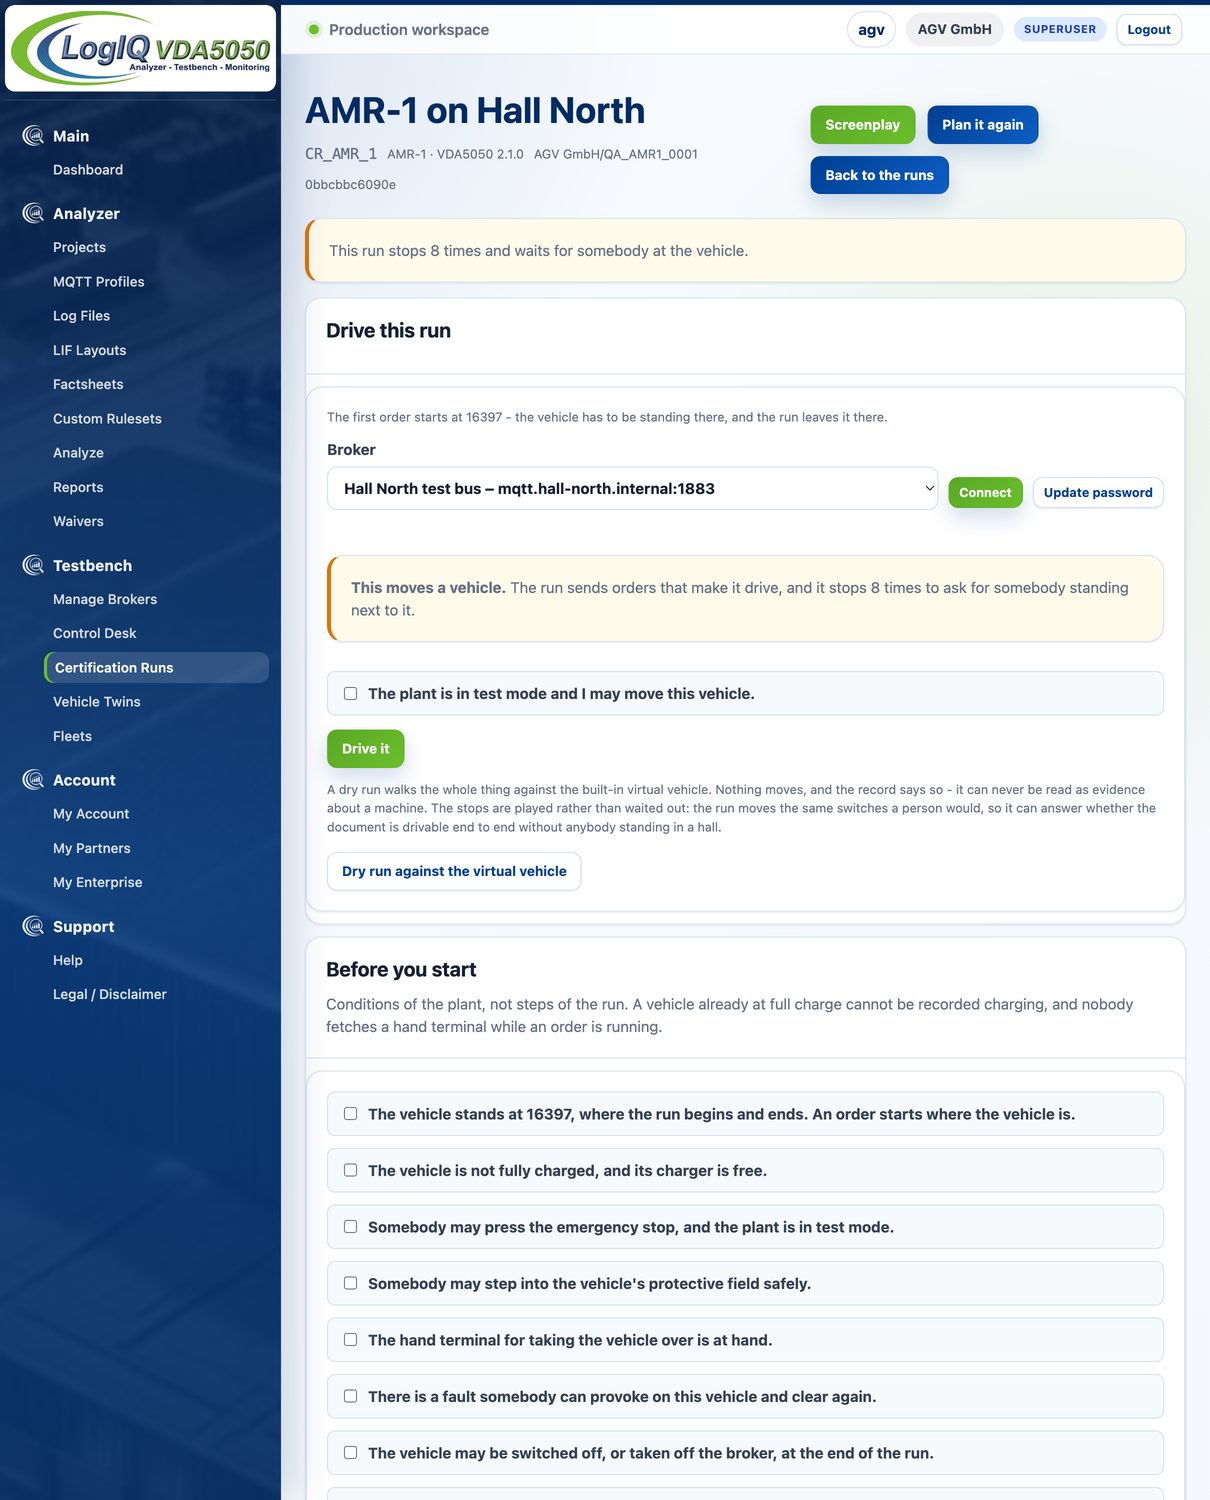
It never sends anything the standard forbids. Our own traffic is judged by the same rules as the vehicle's, and a run that earns findings for our side has cost you the run.
The matrix answers, per scenario, whether this layout and this vehicle can show it at all: the run itself, somebody at the vehicle, or not at all with the reason. Two of the seven gates cannot be sent by any fleet controller — an emergency stop is pressed by a person and a fault has to be provoked and cleared — so those become stops. The run holds there, says who is needed and for what, and goes on when the traffic shows it happened, never on somebody saying it did.
Before anything is started, the run writes itself out for the people who will drive it, and they are not in the same room: whoever starts it is at a screen, whoever presses the emergency stop is at the vehicle. That screenplay opens with the conditions of the plant rather than the steps of the run, because a vehicle already at full charge cannot be recorded charging.
The run never changes when it is driven — the orders are settled before anything is sent, which is what lets a certificate cite a fingerprint. What varies is the attempt, and each attempt gets its own row.
A vehicle twin is a behaviour model of one real machine: how fast it drives, how long it takes over a node, what its states say on the way. It is measured from a recording of that vehicle, or uploaded as a twin document.
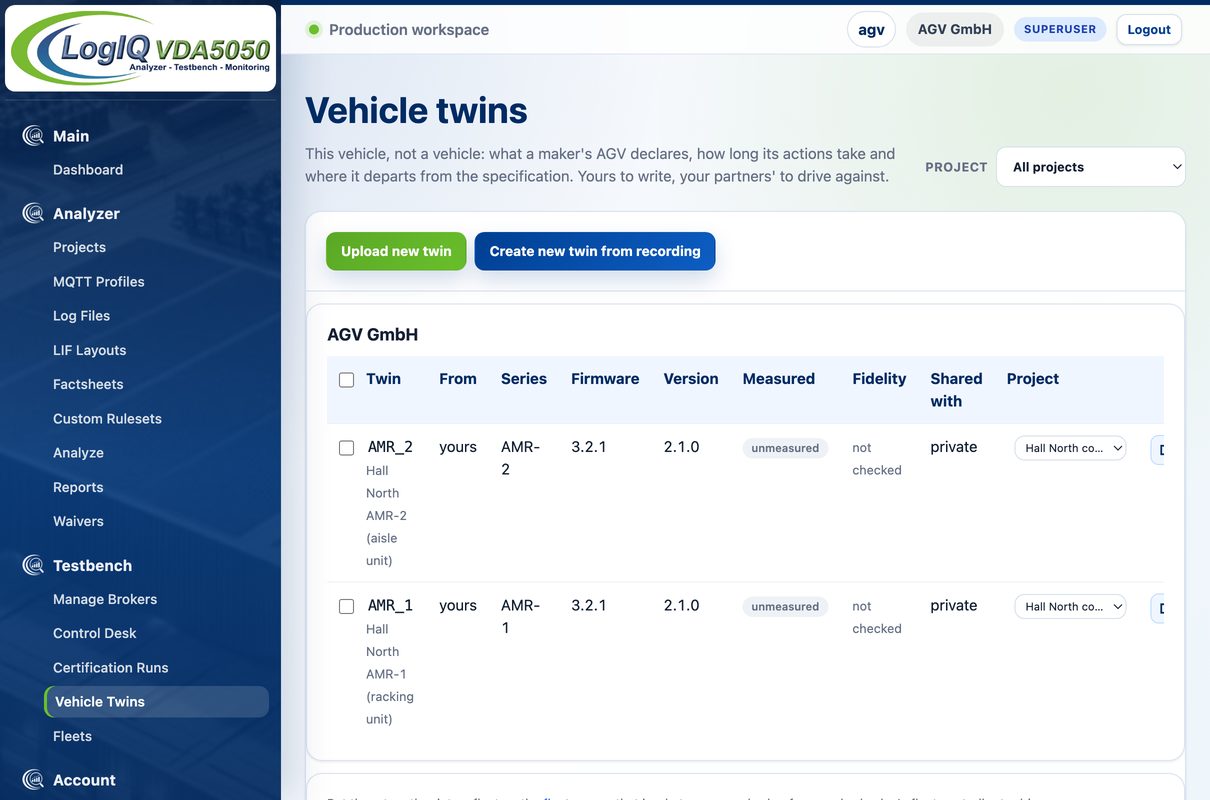
So a measured twin can be checked: a short plan is built over a layout you hold, driven against the twin, and what it does is compared with the recording it came from. The result is one percentage with the figures behind it, and the readings that could not be compared are named rather than passed over.
That matters because everything downstream stands on it. A fleet of twins is only worth driving a fleet controller against if the twins behave like the machines they stand for, and the page says how far they do.
A fleet is a name and a list of twins with how many of each. Starting one puts those vehicles on a broker under their makers' names and leaves them there. A fleet-controller vendor points their own software at them and drives. We command nothing; the vehicles stand there and answer.
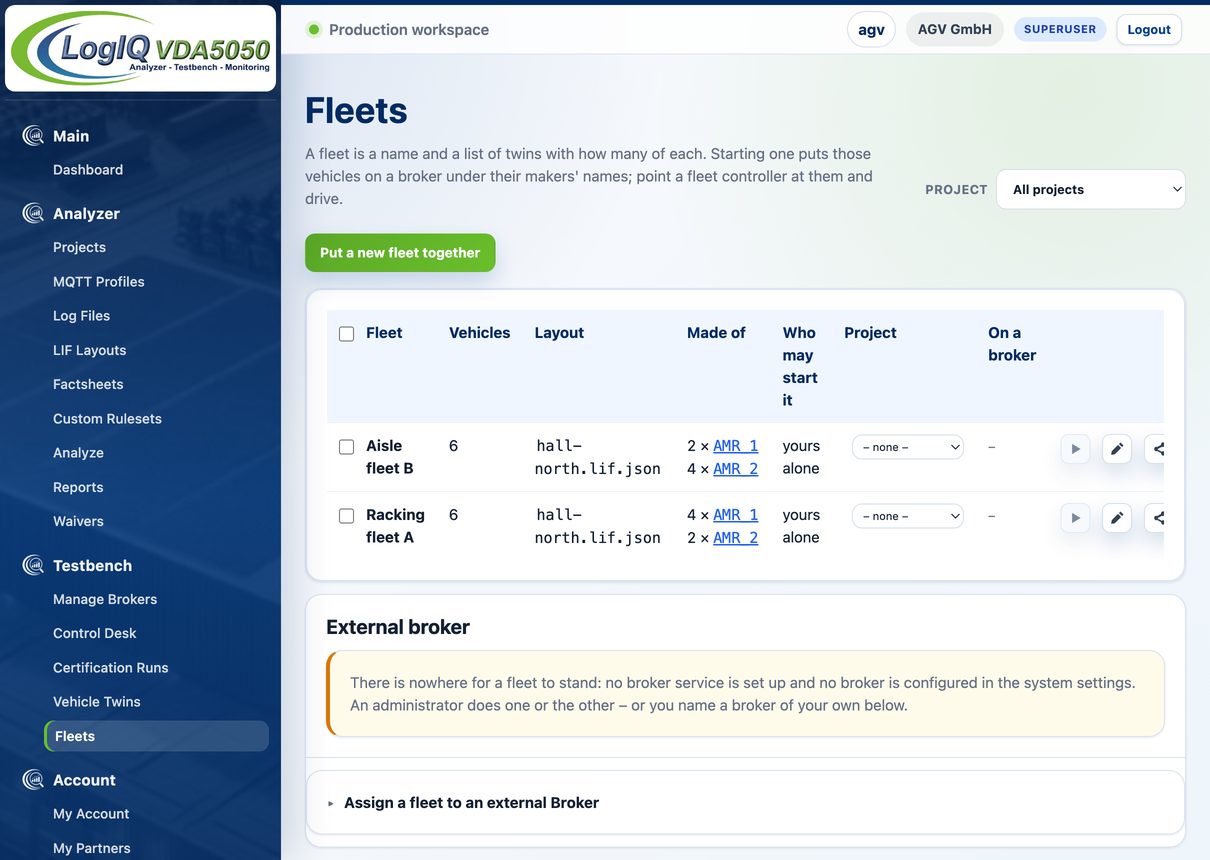
Where a broker service is configured, a fleet asks for a broker of its own and gives it back a quarter of an hour after the last connection closes. Two fleets that must not see each other are never put on the same one.
Starting a fleet also starts a capture of it, named after the fleet, and stopping the fleet stops the capture. What the other side drove is recorded without anybody having to remember to record it.
A fleet goes up whole or not at all. If one twin of it is no longer shared with you, the start is refused with the reason rather than half a fleet appearing on the bus. The identities those vehicles publish are yours to choose, and the service does not check them against real equipment on the same broker.
A capture profile records a shift and stops. A customer installation does not, and neither does the question you are being paid to answer about it. Monitoring is the analyzer pointed at a plant that runs: the same checks, the same findings, but reading months instead of an afternoon.

It stores what a capture profile stores — a broker, its topics, its own check selection, an optional layout. What differs is what it may do: no daily limit, it comes back by itself after a crash, and it starts with the service. Nobody has to remember it after a reboot.
Its runs are not the reading that matters; the interruptions are. A connector's runs break where the connection broke, so the number of them says more about the network than about the fleet. What the page lists instead is every gap between two runs of one recording, with how long it lasted. A recording somebody stopped and started by hand is a new recording, not an interruption, and is left out — otherwise your own maintenance would read as the customer's outage.
While it records, every state message is folded into quarter-hour cells per vehicle: how long the machine drove, how long it stood, what it reported, where it was, how fast, where it braked. Those cells are what the pages below read, which is why they can show months without holding months of traffic. A few hundred megabytes carry years.
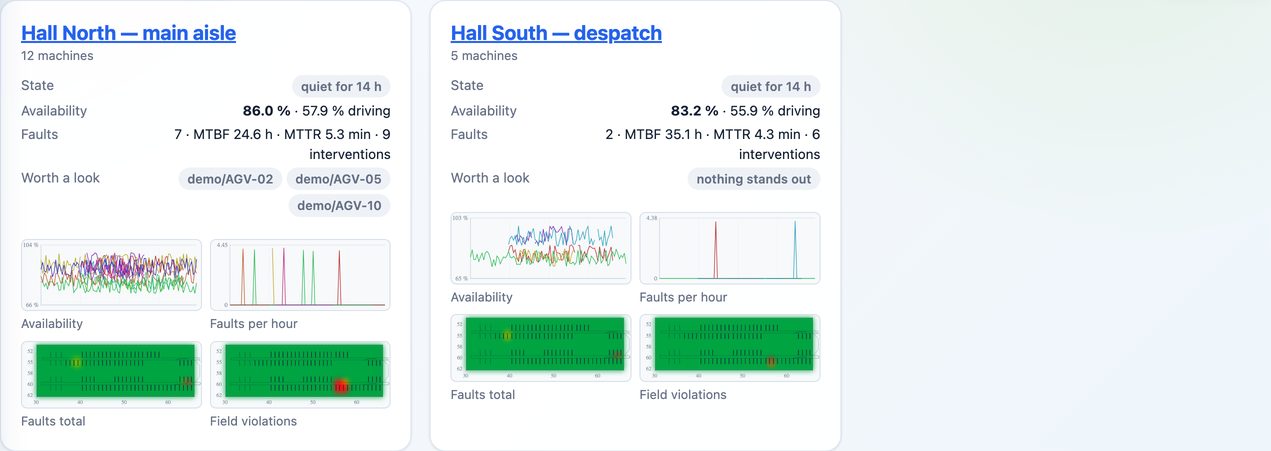
The fleet wall is every connection as one picture, redrawn every few minutes, all of them on one screen. It answers that one question and refuses the others. Click a picture and you are in that fleet's readings.
Only connectors appear on the wall. A capture profile somebody started this morning is not there, and that is deliberate: what belongs on a wall is what is meant never to stop.
While a capture profile records, you can watch the site at work, and when it is over, play it back. A capture across a weekend brings a hundred thousand messages; nobody reads those, so the analyzer speaks up by itself.
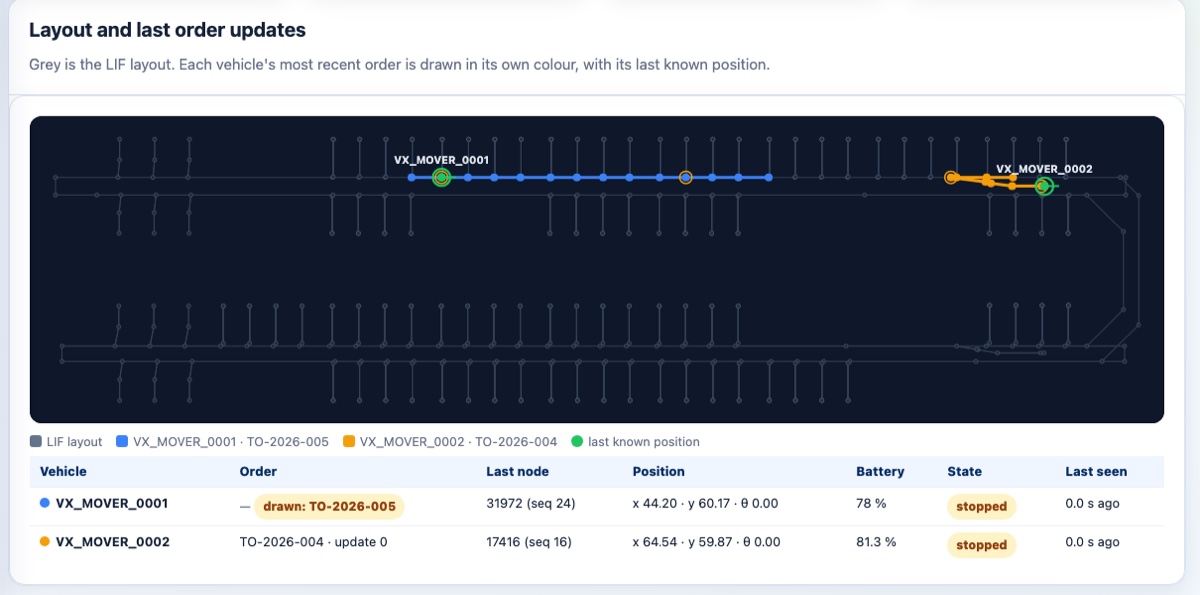
Every vehicle on the LIF layout in its own colour, the last order issued against the last position reported. When the map and the vehicle disagree, the tool names the contradiction. That is the point. Findings appear as they happen.
The same view replays any finished capture or imported log, forwards or backwards, step by step and up to 20×, true to the real message intervals and showing only what was known at each point.
Every X hours, a digest of what stood out since the last report, broken down by severity, vehicle and check, with a link into the running capture. A quiet period is reported too, so silence stays unambiguous.
Or only once enough has accumulated: from X findings, optionally Critical only, Critical and Major, or all severities. The recipients hang on the capture profile, so different sites can have different lists.
Record for days. A restart picks the analysis up where it stood. Nothing is judged twice, nothing skipped, and every start and stop is its own run with its own messages and findings.
The same file, a second question: not whether the messages are right, but what the installation did with the time. Every imported log and every finished capture carries a performance review. No extra instrumentation, no second recording.
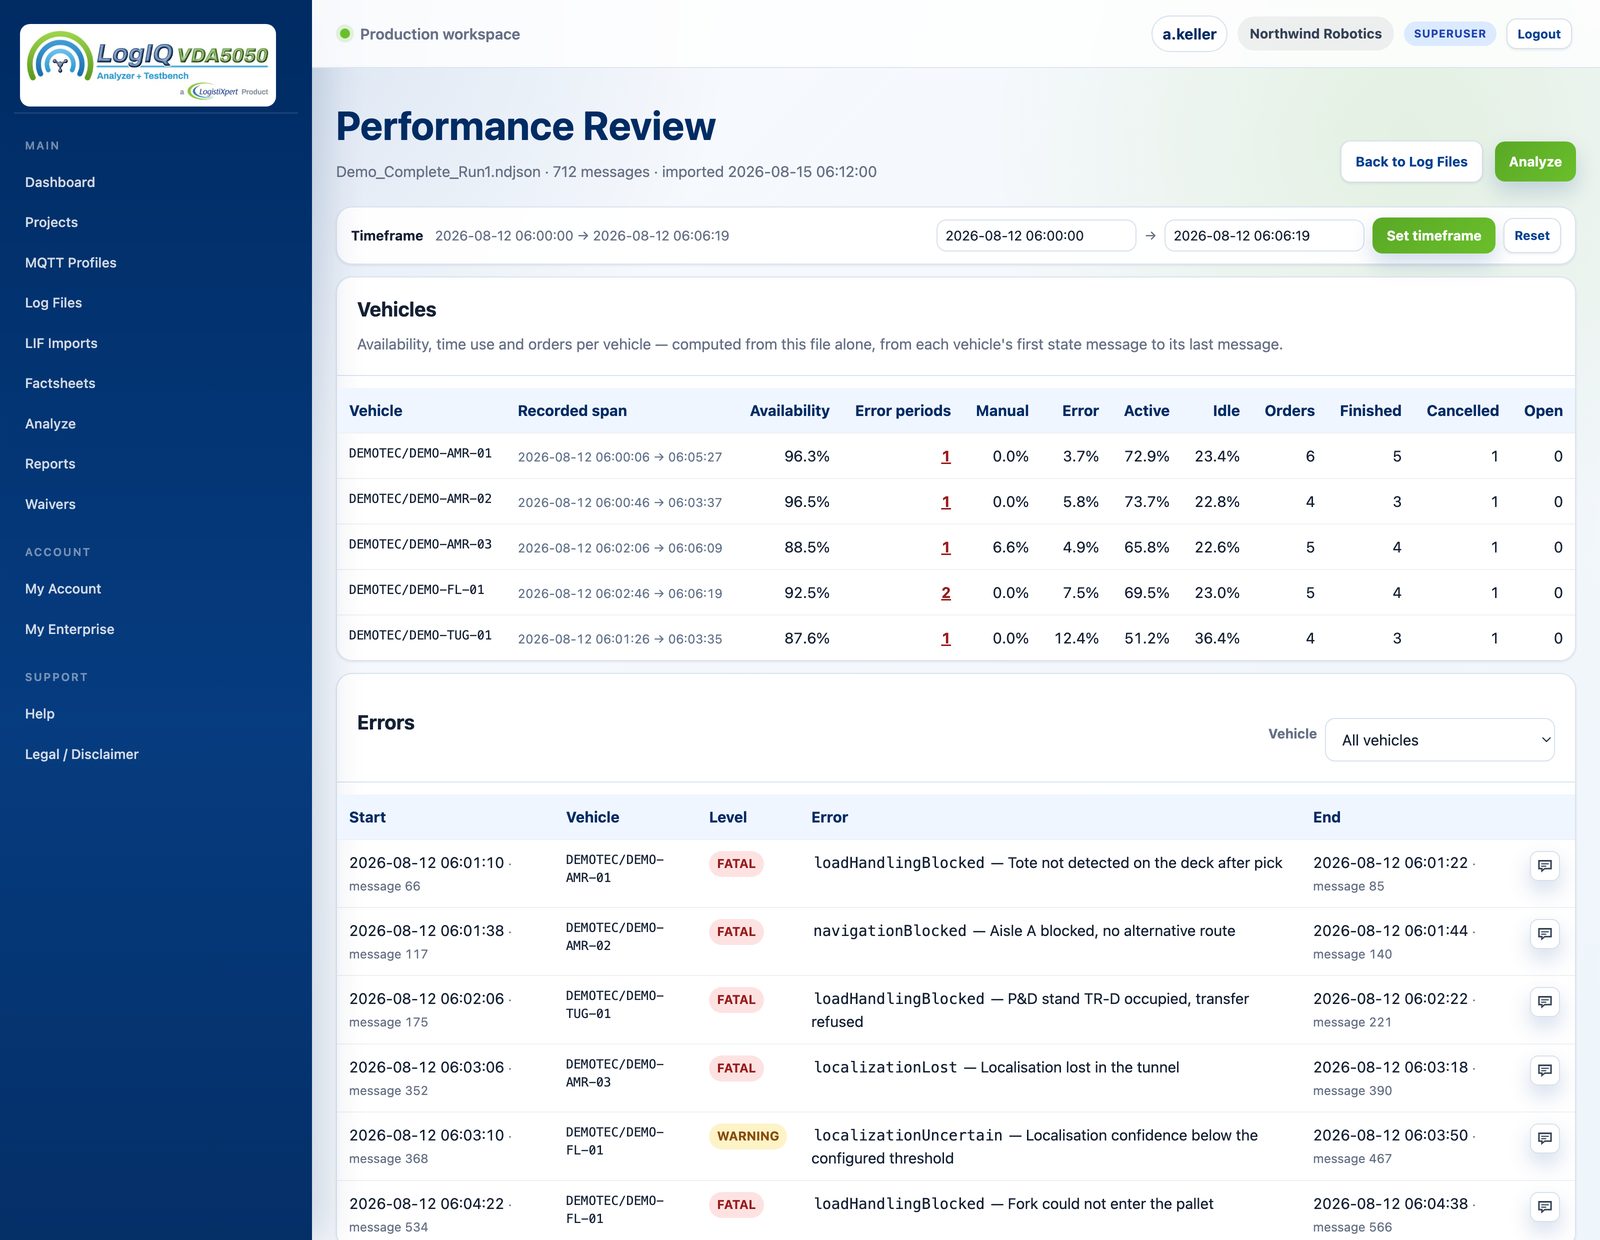
Manual, fault, active, idle and, where it occurs, other. Because exactly one holds at every moment, the shares add up to the recorded span and can be read against each other: the tug above spent 12.4 % of the shift in fault, and one of the AMRs 6.6 % under manual control.
A vehicle reporting an uncertain pose and carrying on is available; only an error above warning level counts against it. That is why the fork-lift above lists two error periods and only one of them is in its 7.5 %: the warning it worked through is in the list, not in the figure.
Not that it is driving. A vehicle standing at the station with a pick running is neither
travelling nor waiting for work; driving would have called it idle. Active
is an order still to finish.
A shift, an hour, the half hour before the standstill. The window is cut before counting rather than filtered afterwards, so the percentages are shares of the period you asked about. One click resets to the whole log.
Under the table, each error period: level, type, description, the state message that first reported it and the one that no longer did, with the minute it began and the message it sits in, one click away.
A third question out of the same recording: not whether the messages are right, and not how the time was spent, but how the vehicles themselves are doing. Fleet Health reads it out of the traffic every compliant vehicle already publishes. No extra sensors, no second recording, nothing to ask of a vendor.
Distance covered, load cycles, hours driven against hours recorded. Service intervals in usage rather than in weeks. A vehicle that ran two shifts a day is due before the one that stood in the corner, and the numbers say so.
Charge cycles, the deepest discharge, and the sag between resting voltage and voltage under traction. That sag is a proxy for internal resistance, which rises with cell ageing long before usable capacity visibly drops.
Every protective-field violation and every emergency stop, counted as events. A field violation is a person, a load or a rack in the driving lane, and no other system in the plant keeps a record that it happened.
Mean time between failures and mean time to recovery per vehicle, and over the fleet a Pareto of the error types, commonest first. Two types usually account for most of the downtime; this says which two.
Half of these fields are optional in the standard. A vehicle that never publishes a distance has not driven zero metres, and the table says “not sent” rather than inventing a nought that reads like a measurement.
Which maintenance-relevant fields these vehicles never sent and which they sent without saying anything: a battery health that never moves, a localisation score that only ever reads 0 or 1. Written before a final acceptance, while there is still something to hold back.
Stated plainly, because it decides what the figures are worth: VDA5050 carries no temperatures, no motor currents and no wear values. This is measured operating statistics with named assumptions. Not condition monitoring and not sold as it.
The counters run from the last recorded service, or, where there is none, from the first recorded cell: driving hours, distance, load cycles, charge cycles, rotation. Nothing in VDA5050 traffic marks a service, so a service is entered by hand. That is the one thing this page cannot learn by watching, and the one thing it asks of you.

Trends. A reading whose recent quarter has left the spread of that machine's own earlier weeks. Two of them earn their keep. Voltage sag under load rises with internal resistance, which rises with cell ageing, months before usable capacity visibly drops. Interventions per hour is somebody walking to the machine, and it finds the fault that produces no error code at all, because a person is quietly compensating for it.
Leg times. Time between two nodes, per machine, judged on the week's fastest traversal rather than its average. A machine that queued behind three others is not a slow machine; what it can still do with a clear lane moves for mechanical reasons.
Warning to failure. The interval between the first warning of a type on a machine and the first failure of the same type on the same machine, learned from the whole recorded history. How long a warning has been worth is a question about years, and last year's failures are where the answer is.
A warning stays open until the same type fails on the same machine. Recording a service does not close it, because nothing in the traffic connects the two, and a warning closed by an assumption is worse than one left standing.
Everyone in a VDA5050 project sooner or later needs the same thing: the messages that actually went over the broker and a statement of what was checked against them. What differs is the question each side brings.
Show that your vehicles conform before they ship. Answer a complaint with the messages that were actually sent. A run on your own bench settles most of what a customer asks in the first week of commissioning.
Test orders and instantActions against several vehicle types before a customer does. Regressions between releases show up when you run the same scope on a new build. Write down once what you require of a vehicle and let each manufacturer measure against it.
Accept third-party systems without taking a supplier's word for it. A run over the weekend, a report on Monday, and a finding that leads to the message and the field that caused it, which is what a supplier call needs.
Keep evidence of what the installation did, in a form that outlasts a change of staff. The fault on a Friday evening is already recorded, with the state messages around it.
A documented, repeatable scope instead of home-grown scripts, multi-tenant across enterprises and projects, with your own name and mark on the report.
State in the invitation what a bid has to prove, as a file rather than as prose. What comes back is measured against it, the same way for every bidder and readable without the tool.
Recordings from a live installation rarely leave the network. The analyzer runs where they are.
Two editions and nothing else. Hosted is our instance, nothing to put up. Dedicated is a sealed image with a licence file, brought up with Docker Compose: one file, one command, on your hardware or on a server we build for you.
MQTT over TLS, with your own CA certificate where the site uses one. Broker passwords are stored encrypted, never in plain text.
On your own network the installation carries a signed licence file, checked locally. Grace on expiry, then read-only. Nothing you recorded is ever locked away.
Test houses can put their own name and mark on the report, the export and the digests. The name of the tool stays underneath.
Reports and runs sit behind unguessable ids, with an ownership check on every access.
Member, superuser, administrator: who may delete what is defined and enforced in one place.
Colleagues share one enterprise; logs, layouts and reports are filed under a project and can be filtered by it. What a plan limits is scope, meaning people, projects and profiles, not how much traffic you analyse.
More than 1,700 automated tests run before every release.
An independent conformance checker for AGV and AMR fleet communication. It reads VDA5050, VDMA M2X and VDMA LIF messages, from a log file or live over MQTT, and shows whether a vehicle and its fleet controller interpret the standard the same way, backed by an auditable report.
VDA5050, VDMA M2X and VDMA LIF, with 261 checks: 234 for VDA5050 in its four versions, 12 for M2X and 15 for LIF layouts.
Both. Point it at a log file or connect it to live MQTT for a real-time fleet view, session replay and unattended monitoring.
Yes. Dedicated ships as a sealed Docker image with a licence file and runs in your own network, so protocol data never has to leave it, on your hardware or on a server we build for you. The other edition is Hosted, our own instance at logiq-vda5050.com.
Every run states which checks ran, which did not apply and why. Reports from the instances we operate are cryptographically signed, and anyone can verify one against the public key at logistixpert.de/verify.
No. LogistiXpert is independent, with no vendor ties and no stake in the outcome. The point is neutral evidence both sides can trust.
A walk-through of the demo package that ships with the product: one clean and one faulty data set with a matching layout.
One recording from your installation, analysed and discussed together.
Hosted at logiq-vda5050.com or a dedicated installation in your own network with Docker.
The LogIQ VDA5050 Analyzer provides diagnostic guidance. It issues no certification and no release approval. VDA 5050 is a specification of the VDA, LIF and M2X are specifications of the VDMA; the designations are used here to say what this tool reads. This is an independent tool, not affiliated with or endorsed by either body. See the imprint.